
UNITED STATES
SECURITIES AND EXCHANGE COMMISSION
Washington, D.C. 20549
FORM 8-K
CURRENT REPORT
PURSUANT TO SECTION 13 OR 15(d) OF THE SECURITIES EXCHANGE ACT OF 1934
Date of report (Date of earliest event reported): July 29, 2008
Liberty Global, Inc.
(Exact Name of Registrant as Specified in Charter)
| Delaware | 000-51360 | 20-2197030 | ||
| (State or other jurisdiction of incorporation) |
(Commission File Number) |
(IRS Employer Identification #) |
12300 Liberty Boulevard Englewood, CO 80112
(Address of Principal Executive Office)
(303) 220-6600
(Registrant’s telephone number, including area code)
Check the appropriate box below if the Form 8-K filing is intended to simultaneously satisfy the filing obligation of the registrant under any of the following provisions:
| ¨ | Written communications pursuant to Rule 425 under the Securities Act (17 CFR 230.425) |
| ¨ | Soliciting material pursuant to Rule 14a-12 under the Exchange Act (17 CFR 240.14a-12) |
| ¨ | Pre-commencement communications pursuant to Rule 14d-2(b) under the Exchange Act (17 CFR 240.14d-2(b)) |
| ¨ | Pre-commencement communications pursuant to Rule 13e-4(c) under the Exchange Act (17 CFR 240.13e-4(c)) |
| Item 2.02 | RESULTS OF OPERATIONS AND FINANCIAL CONDITION/ ITEM 7.01 REGULATION FD DISCLOSURE |
Liberty Global, Inc. (Liberty Global) indirectly owns 37.8% of Jupiter Telecommunications Co., Ltd. (J:COM). J:COM, a consolidated subsidiary of Liberty Global, is a separate public company with shares listed on the JASDAQ. J:COM is Japan’s largest multiple system operator, based on the number of customers served, providing cable television, Internet access and telephone services in Japan.
On July 29, 2008, and pursuant to JASDAQ’s rules, J:COM publicly announced in Japan its results for the six months ended June 30, 2008 by issuing a press release. The full text of an English language translation of that press release, appearing in Exhibit 99.1 hereto, is incorporated herein by reference.
That attached document is furnished under both Item 2.02 “Results of Operations and Financial Condition” and Item 7.01 “Regulation FD Disclosure.”
The attached document refers to historical “Operating Cash Flow (OCF)” and “Free Cash Flow,” which are non-GAAP financial measures within the meaning of Regulation G. A reconciliation of historical OCF to the most directly comparable GAAP financial measure is presented below (yen 100 million):
| Six Months Ended June 30, |
||||||
| 2008 | 2007 | |||||
| OCF |
587 | 519 | ||||
| Depreciation and amortization |
(333 | ) | (316 | ) | ||
| Stock compensation |
— | — | ||||
| Operating income |
254 | 203 | ||||
Historical Free Cash Flow is reconciled to the most directly comparable GAAP financial measure on page 20 of Exhibit 99.1, under the heading “Highlights of 2008 Q2.”
J:COM defines (i) OCF as revenue less operating and programming costs less selling, general and administrative expenses (exclusive of stock compensation, depreciation and amortization.) and (ii) Free Cash Flow as cash provided by operating activities less capital expenditures including capital lease expenditures.
OCF and Free Cash Flow are important metrics by which J:COM’s management evaluate the performance of J:COM’s business. We believe that investors should have access to the same metrics. These non—GAAP financial measures should be considered in addition to results prepared in accordance in GAAP, but should not be considered a substitute for or superior to GAAP results.
Forward-Looking Statements
This press release contains forward-looking statements within the meaning of the Private Securities Litigation Reform Act of 1995, including statements regarding J:COM’s 2008 annual forecast, financial and subscriber trends, and business, product and marketing strategies. These forward-looking statements involve certain risks and uncertainties that could cause actual results to differ materially from those expressed or implied by these statements. These risks and uncertainties include the continued use by subscribers and potential subscribers of J:COM’s services, changes in technology, regulation and competition, J:COM’s ability to achieve expected operational efficiencies and economies of scale, J:COM’s ability to generate expected revenue, operating cash flow and dividends and achieve assumed margins including, to the extent annualized figures imply forward-looking projections, continued performance comparable with the period annualized, as well as other factors that may be applicable to J:COM and its business detailed from time to time in Liberty Global’s filings with the Securities and Exchange Commission and J:COM’s filings with the JASDAQ. These forward-looking statements speak only as of the date of this release. Liberty Global expressly disclaims any obligation or undertaking to disseminate any updates or revisions to any guidance and other forward-looking statement contained herein to reflect any change in Liberty Global’s or J:COM’s expectations with regard thereto or any change in events, conditions or circumstances on which any such statement is based.
2
SIGNATURE
Pursuant to the requirements of the Securities Exchange Act of 1934, the registrant has duly caused this report to be signed on its behalf by the undersigned hereunto duly authorized.
| LIBERTY GLOBAL, INC. | ||
| By: | /s/ RANDY L. LAZZELL | |
| Randy L. Lazzell | ||
| Vice President | ||
Date: July 29, 2008
3
EXHIBIT 99.1
Jupiter Telecommunications Co., Ltd.
(Translation from Japanese disclosure to JASDAQ)
July 29, 2008
[U.S. GAAP]
Consolidated Semi-annual Financial Results Release
For the Six Months Ended June 30, 2008
Jupiter Telecommunications Co., Ltd. (Consolidated)
Company code number: 4817 (URL ; http://www.jcom.co.jp/english.html )
Shares traded: JASDAQ
Executive position of legal representative: Tomoyuki Moriizumi, Chief Executive Officer
Please address all communications to:
| Koji Kobayashi, IR Department |
Phone: +81-3-6765-8157 E-Mail: KobayashiKo@jupiter.jcom.co.jp |
Expected date of filing of semi-annual report: September 29, 2008
Expected date of dividend payment: September 8, 2008
1. Consolidated financial results (From January 1, 2008 to June 30, 2008)
(1) Consolidated operating results
| (In millions of yen, with fractional amounts rounded) | ||||||||||||
| Revenue | Operating income | Income before income taxes | ||||||||||
| (Millions of yen) | % | (Millions of yen) | % | (Millions of yen) | % | |||||||
| Six months ended June 30, 2008 |
143,815 | 12.3 | 25,440 | 25.4 | 22,722 | 29.1 | ||||||
| Six months ended June 30, 2007 |
128,116 | 24.0 | 20,293 | 30.1 | 17,603 | 30.4 | ||||||
| Year ended December 31, 2007 |
264,508 | 42,816 | 37,506 | |||||||||
| Net income | Net income per share | Net income per share, (diluted) | ||||||||||
| (Millions of yen) | % | (Yen) | (Yen) | |||||||||
| Six months ended June 30, 2008 |
13,063 | 13.2 | 1,906.79 | 1,903.49 | ||||||||
| Six months ended June 30, 2007 |
11,538 | 42.1 | 1,803.39 | 1,795.57 | ||||||||
| Year ended December 31, 2007 |
23,992 | 3,650.27 | 3,638.93 | |||||||||
(Notes)
1. Equity in earnings of affiliates;
| For the six months ended June 30, 2008: 284 million yen |
For the six months ended June 30, 2007: 136 million yen | |
| For the year ended December 31, 2007: 291 million yen |
2. The percentages shown next to revenue, operating income, income before income taxes and net income represent year-on-year changes.
(2) Consolidated financial position
| Total assets | Shareholders’ equity | Equity capital ratio to total assets |
Shareholders' equity per share | |||||
| (Millions of yen) | (Millions of yen) | % | (Yen) | |||||
| June 30, 2008 |
687,820 | 344,286 | 50.1 | 50,213.51 | ||||
| June 30, 2007 |
632,672 | 291,988 | 46.2 | 45,518.11 | ||||
| December 31, 2007 |
680,416 | 330,009 | 48.5 | 48,195.11 | ||||
(3) Consolidated cash flow statement
| Cash flows from operating activities |
Cash flows from investing activities |
Cash flows from financing activities |
Balance of cash & cash equivalents | |||||||
| (Millions of yen) | (Millions of yen) | (Millions of yen) | (Millions of yen) | |||||||
| Six months ended June 30, 2008 |
44,825 | (20,064 | ) | (15,383 | ) | 32,268 | ||||
| Six months ended June 30, 2007 |
47,155 | (24,790 | ) | (13,474 | ) | 29,377 | ||||
| Year ended December 31, 2007 |
95,226 | (52,728 | ) | (40,094 | ) | 22,890 | ||||
1
Jupiter Telecommunications Co., Ltd.
(Translation from Japanese disclosure to JASDAQ)
2. Dividend information
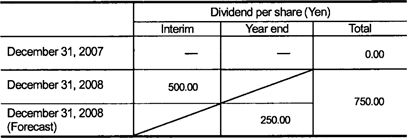
Dividend per share (Yen)
Interim Year end Total
December 31, 2007 ¯ ¯ 0.00
December 31, 2008 500.00 750.00
December 31, 2008 (Forecast) 250.00
(Notes) Interim dividend amount per share ¥500 includes ¥250 as a special dividend.
3. Consolidated forecasts for the fiscal year ending December 31, 2008 (from January 1, 2008 to December 31, 2008)
| Revenue | Operating income | Income before income taxes |
Net income | Net income per share | ||||||||||||||
| (Millions of yen) | (%) | (Millions of yen) | (%) | (Millions of yen) | (%) | (Millions of yen) | (%) | (Yen) | ||||||||||
| Annual |
295,000 | 11.5 | 50,000 | 16.8 | 45,000 | 20.0 | 27,000 | 12.5 | 3,939.31 | |||||||||
(Notes)
1. The percentages shown next to revenue, operating income, income before income taxes and net income represent year-on-year changes
2. There are no changes from the press release dated January 30, 2008, except "Net income per share"
4. Other information
(1) Change in significant consolidated subsidiaries : None
(2) Change in significant accounting and reporting policies
1. Change caused by revision of accounting standards and other regulations : None
2. Change in accounting methods other than above : None
(3) Outstanding shares
1. Number of issued shares at end of term (consolidated):
| As of June 30, 2008: 6,936,442 shares |
As of June 30, 2007: 6,414,769 shares | As of December 31, 2007: 6,927,357 shares |
2. Number of treasury stock:
| As of June 30, 2008: 80,000 shares |
As of June 30, 2007: 0 shares | As of December 31, 2007: 80,000 shares |
(Note) Regarding number of shares basis of per share data, please refer to page 14.
2
Jupiter Telecommunications Co., Ltd.
(Translation from Japanese disclosure to JASDAQ)
(Ref) Parent Company Only [JAPANESE GAAP]
1. Financial results (From January 1, 2008 to June 30, 2008)
(1) Operating results
| (In millions of yen, with fractional amounts rounded) | ||||||||||||
| Revenue | Operating income | Ordinary income | ||||||||||
| (Millions of yen) | (%) | (Millions of yen) | (%) | (Millions of yen) | (%) | |||||||
| Six months ended June 30, 2008 |
56,092 | 13.2 | 4,995 | 74.3 | 5,120 | 65.3 | ||||||
| Six months ended June 30, 2007 |
49,566 | 4.9 | 2,866 | 464.4 | 3,097 | 32.7 | ||||||
| Year ended December 31, 2007 |
107,807 | 8,147 | 8,656 | |||||||||
| Net income | Net income per share | |||||
| (Millions of yen) | (%) | (yen) | ||||
| Six months ended June 30, 2008 |
3,961 | 30.8 | 578.17 | |||
| Six months ended June 30, 2007 |
3,029 | 37.0 | 473.44 | |||
| Year ended December 31, 2007 |
6,327 | 962.71 | ||||
(Notes) The percentages shown next to revenue, operating income, ordinary income and net income represent year-on-year changes.
(2) Financial position
| (In millions of yen, with fractional amounts rounded) | ||||||||
| Total assets | Net assets | Equity capital ratio to total assets |
Net assets per share | |||||
| (Millions of yen) | (Millions of yen) | (%) | (Yen) | |||||
| June 30, 2008 |
414,932 | 251,593 | 60.6 | 36,691.05 | ||||
| June 30, 2007 |
375,876 | 199,259 | 53.0 | 31,059.51 | ||||
| December 31, 2007 |
427,146 | 246,458 | 57.7 | 35,991.30 | ||||
| (Notes) Stockholders’ equity: | As of June 30, 2008 | ¥251,570 million | As of December 31, 2007 | ¥246,444 million | ||||
| As of June 30, 2007 | ¥199,256 million |
(Cautionary note regarding future-related information)
The forecasts contained in this report have been prepared on the basis of information that is currently available. Because such estimates are inherently very uncertain, actual results may differ from the forecasts. The Company does not guarantee that it will achieve these estimated results and advises readers to refrain from depending solely on these forecasts. Readers should also note that the Company is under no obligation to revise this information on a regular basis.
3
Jupiter Telecommunications Co., Ltd.
(Translation from Japanese disclosure to JASDAQ)
1. Business Results
(1) Analysis of Business Results
a. Business Results for the First Half of the Current Fiscal Year
Status of J:COM
Jupiter Telecommunications Co., Ltd.’s consolidated group (the J:COM Group or the Company) positioned this fiscal year as one for achieving strong growth in cable television services. During the first half of this year, the J:COM Group has made steady progress with its Volume plus Value growth strategy and its content strategy.
The status of various efforts to implement its growth strategy is as follows.
In pursuit of its volume strategy and the focus on increasing subscribing households, the J:COM Group increased the number of customer contact points by diversifying its sales routes. In particular, it strengthened marketing efforts at J:COM Shops which provide direct experience of the J:COM Group’s services to prospective customers to increase the efficiency of its sales operations. The first J:COM Shop was launched in April 2007 and we now have 37 shops as the end of June 2008.
The J:COM Group continues to seek equity-base alliances and acquire cable television companies and expanded its coverage areas by the January 2008 acquisition of a controlling interest in Kyoto Cable Communications Co., Ltd. and the February 2008 acquisition of the cable television business in the certain areas of the Kobe City Development & Management Foundation. The J:COM Group has also re-organized its consolidated subsidiaries and operations to improve its operational efficiencies and competitiveness. As a part of these efforts, Fukuoka Cable Network Co., Ltd.(FCN) which is in Kyushu region, announced its merger with Cable Vision 21 Inc., a subsidiary of J:COM, effective September 1, 2008. Through this merger, FCN, which has been the only equity-method affiliate among J:COM’s cable television systems, will become a consolidated subsidiary of J:COM.
In pursuit of its value strategy, the J:COM Group aims to improve monthly average revenue per user(ARPU). The J:COM Group worked to raise the number of services offered per subscribing households (bundle ratio) and to increase added value in existing services. In the area of high-speed Internet access services, it expanded the coverage area for 160 Mbps super high-speed Internet access services beyond the Kansai area, where this service was initially launched in 2007. The J:COM Group nearly achieved full roll-out by the end of July 2008 excluding Kyoto Cable Communications Co., Ltd. The J:COM Group’s high-speed Internet access services are highly competitive in comparison to the services offered by other major telecommunications companies. This service gained the attention of subscribers and contributed to an increase in subscriber numbers as well as growth in ARPU. We plan to provide this service throughout the J:COM Group by the end of January 2009.
In pursuit of its content strategy, the J:COM Group improved the quality of its programming content through the broadcasting of a new channel (Channel Ginga) in April 2008. The J:COM Group also enhanced its channel lineup through the addition of two highly rated U. S. channels, FOXCRIME and the Sci Fi Channel in March and April 2008, respectively.
In addition, as a facet of the activities to market “J:COM on Demand,” the J:COM Group plans to provide NHK(Japan Broadcasting Corporation) on Demand distribution service via J:COM on Demand service in December 2008. This will be a service that allows viewers to enjoy NHK television programming of their
4
Jupiter Telecommunications Co., Ltd.
(Translation from Japanese disclosure to JASDAQ)
choice, at their convenience. NHK on Demand consists of two types of services, NHK Archive Selection and Catch UP programs. Adding this new service to the J:COM lineup is expected to increase both the overall number of subscribers and utilization of the “J:COM on Demand” service.
To diversify its income sources, the J:COM Group last year launched a full-scale entry into the advertising business. To further enhance its marketing capabilities in the advertising field, the J:COM Group has integrated its marketing operations into a newly established Ad Sales Division under the Jupiter TV Company to increase its operating efficiencies through improved synergies in April 2008.
As a result of the above-mentioned measures, the total number of subscribing households (the number of households that subscribe to one or more services) of consolidated managed system operators increased 177,500 households (7%) from June 30, 2007 to 2,759,600 households at June 30, 2008. By type of service, cable television subscribers grew by 107,900 households (5%) since June 30, 2007 to 2,245,500 households as of June 30, 2008. High-speed Internet access subscribers increased by 123,400 households (11%) from June 30, 2007 to 1,280,600 households and telephony service subscribers grew by 191,800 households (16%) from June 30, 2007 to 1,404,900 households. The bundle ratio increased from 1.75 as of June 30, 2007 to 1.79 as of June 30, 2008 and ARPU reached ¥7,754 for the six months ended June 30, 2008, up ¥101 from the same period of the previous fiscal year.
In the following discussion, we quantify the impact of acquisitions on our results of operations. The acquisition impact represents our estimate of the difference between the operating results of the periods under comparison that is attributable to the timing of an acquisition. In general, we base our estimate of the acquisition impact on an acquired entity’s operating results during the first three months following the acquisition date such that changes from those operating results in subsequent periods are considered to be organic changes. Included as acquisition in the below discussion are the July 2007 acquisition of Jupiter Visual Co. Ltd, the September 2007 merger with Jupiter TV Co., Ltd. and its subsidiaries and affiliates (JTV Group), the January 2008 acquisition of Kyoto Cable Communications Co. Ltd., and the February acquisition of Kobe City Development & Management Foundation.
Revenue
Revenue increased by ¥15,699 million, or 12%, from ¥128,116 million for the six months ended June 30, 2007 to ¥ 143,815 million for the six months ended June 30, 2008. This increase includes ¥6,814 million that is attributable to the aggregate impact of acquisitions. Excluding the effects of these acquisitions, total revenue increased by ¥ 8,885 million, or 7%.
Subscription fees increased by ¥9,342 million, or 8%, from ¥112,761 million for the six months ended June 30, 2007 to ¥122,103 million for the six months ended June 30, 2008. This increase was due primarily to an 8% organic growth of subscription fees and the addition of subscription fees from newly consolidated subsidiaries. This increase includes ¥928 million that is attributable to the aggregate impact of acquisitions. Excluding the impact of acquisitions, subscription fees increased by ¥8,414 million, or 8%.
Cable television subscription fees increased by ¥4,873 million, or 8 %, from ¥60,507 million for the six months ended June 30, 2007 to ¥65,380 million for the six months ended June 30, 2008. This 8% increase in cable television subscription fees was due to a 7 % organic growth of subscription fees, the addition of fees from newly consolidated subsidiaries, and the increasing proportion of cable television subscribers who subscribe to our digital service, for which we charge a higher fee compared to our analog service. As of June 30, 2008, 73 % of cable television subscribers were receiving our digital service, compared to 59% as of June 30, 2007.
5
Jupiter Telecommunications Co., Ltd.
(Translation from Japanese disclosure to JASDAQ)
High-speed Internet access subscription fees increased by ¥2,892 million, or 9 %, from ¥32,631 million for the six months ended June 30, 2007 to ¥35,523 million for the six months ended June 30, 2008. This increase in high-speed Internet access subscription fees was primarily attributable to a 9 % organic increase in subscription fees and the addition of fees from newly consolidated subsidiaries partially offset by lower ARPU due to product bundling discounts.
Telephony subscription fees increased by ¥1,577 million, or 8%, from ¥19,623 million for the six months ended June 30, 2007 to ¥21,200 million for the six months ended June 30, 2008. This increase in telephony subscription fees was attributable to an 8% organic increase in subscription fees that were partially offset by a decrease in call charges.
Other revenue increased by ¥6,357 million, or 41 % , from ¥15,355 million for the six months ended June 30, 2007 to ¥21,712 million for the six months ended June 30, 2008. This increase includes ¥5,886 million that is attributable to the aggregate impact of acquisitions primarily attributable to the merger with JTV Group.
Operating costs and expenses.
Operating and programming costs increased by ¥4,484 million, or 9 %, from ¥51,319 million for the six months ended June 30, 2007 to ¥55,803 million for the six months ended June 30, 2008. This increase includes ¥2,616 million that is attributable to the aggregate impact of acquisitions. The remaining increases are due primarily to programming and interconnect costs which are directly related to growth of our subscriber base.
Selling, general and administrative expenses increased by ¥4,323 million, or 17 %, from ¥25,010 million for the six months ended June 30, 2007 to ¥29,333 million for the six months ended June 30, 2008. This increase includes ¥2,622 million that is attributable to the aggregate impact of acquisitions. The remaining increase is primarily attributable to increase in personnel costs.
Depreciation and amortization expenses increased by ¥1,745 million, or 6 %, from ¥31,494 million for the six months ended June 30, 2007 to ¥33,239 million for the six months ended June 30, 2008. The increase is attributable to the aggregate impact of acquisitions and additions to fixed assets related to the installation of services to new customers.
Operating income, as a result of the above items, increased by ¥5,147 million, or 25 %, from ¥20,293 million for the six months ended June 30, 2007 to ¥25,440 million for the six months ended June 30, 2008.
Interest expense, net increased by ¥234 million, or 11 %, from ¥2,095 million for the six months ended June 30, 2007 to ¥2,329 million for the six months ended June 30, 2008.
Income before income taxes increased by ¥5,119 million, or 29 %, from ¥17,603 million for the six months ended June 30, 2007 to ¥22,722 million for the six months ended June 30, 2008.
Net income increased by ¥1,525 million, or 13 %, from ¥11,538 million for the six months ended June 30, 2007 to ¥13,063 million for the six months ended June 30, 2008 for the reasons set forth above.
6
Jupiter Telecommunications Co., Ltd.
(Translation from Japanese disclosure to JASDAQ)
b. Forecasts for the Fiscal Year Ending December 2008
The most important issue for the J:COM Group this fiscal year is one for achieving strong growth in cable television services. To achieve this goal, the J:COM Group will use one of its greatest strengths— diversified marketing touch points finely tailored for each region. In addition, the J:COM Group’s value-added services such as high-speed Internet access and enhanced cable television services, improves the level of subscriber satisfaction and differentiates the J:COM Group from its competitors, which leads to increases in subscriber numbers and ARPU.
J:COM Group forecasts revenue of ¥295 billion, operating income of ¥50 billion, and net income of ¥27 billion for this fiscal year.
(2) Financial position
Asset, Liability and Stockholders’ equity
Total assets increased by ¥7,404 million, from ¥680,416 million as of December 31, 2007 to ¥687,820 million as of June 30, 2008. The increase is primarily due to acquisitions made in the first quarter of 2008.
Total liabilities decreased by ¥8,098 million, from ¥345,008 million as of December 31, 2007 to ¥336,910 million as of June 30, 2008. The decrease is primarily due to decrease in long-term debt, accounts payable and income tax payable.
Stockholders’ equity increased by ¥14,277 million, from ¥330,009 million as of December 31, 2007 to ¥344,286 million as of June 30, 2008. The increase is primarily due to net income for the six months ended June 30, 2008.
Cash flows
For the six months ended June 30, 2008, the net cash provided by our operating activities of ¥44,825 million and existing cash and cash equivalent was used to fund net cash used in our investing and financing activities of ¥20,064 million and ¥15,383 million, respectively.
Cash Provided by Operating Activities. Net cash flows provided by operating activities decreased ¥2,330 million, or 5% from ¥47,155 million for the six months ended June 30, 2007 to ¥44,825 million for the six months ended June 30, 2008. The decrease is primarily attributable to (i) an increase in cash used for our operating and SG&A expenses, (ii) an increase in cash paid for income taxes and (iii) an increase in cash used as a result of changes in our working capital accounts. These decreases were partially offset by an increase in our revenue for the six months ended June 30, 2008.
Cash Used in Investing Activities. Net cash used in investing activities decreased ¥4,726 million from ¥24,790 million for the six months ended June 30, 2007 to ¥20,064 million for the six months ended June 30, 2008. The net cash used for the six months ended June 30, 2008 primarily consisted of ¥17,254 million for capital expenditures and ¥2,841 million for our acquisition of new subsidiary and business operations.
Cash Used in Financing Activities. Net cash used in financing activities increased ¥1,909 million, or 14% from ¥13,474 million for the six months ended June 30, 2007 to ¥15,383 million for the six months ended June 30, 2008. The increase is primarily attributable to the net impact of (i) a ¥1,843 million decrease in proceeds received from the issuance of our common stock, (ii) a ¥842 million increase in net principal repayments of debt and capital lease obligations and (iii) a ¥776 million increase of other financing activities.
7
Jupiter Telecommunications Co., Ltd.
(Translation from Japanese disclosure to JASDAQ)
(3) Fundamental Policy Regarding the Distribution of Profits and Dividends
The Company is strongly aware that the distribution of profits to shareholders is an important management issue. In the first-half of the current fiscal year under review, the Company will start to pay dividends, while also continuing to increase the J:COM Group’s internal reserves for future potential investments such as acquisition of other companies or capital investment, as it executes a policy of stable and continuous returns to shareholders.
The interim dividend will be ¥500 per share, which includes a special dividend of ¥250 per share. A year-end dividend of ¥250 per share is planned.
Going forward, it is the Company’s policy to provide sound returns to shareholders while continuing to ensure the sustainable growth of its business.
2. Status of the Jupiter Telecommunications Co., Ltd. (J:COM) Group
Omitted since there have been no significant changes in the J:COM Group’s status as described in the latest Annual Securities Reports (submitted on March 27, 2008).
3. Management Policy
(1) Fundamental Management Policy
Omitted since there have been no significant changes in the J:COM Group’s fundamental management policy as described in the Consolidated Annual Financial Results Release for the Year Ended December 31,2007 (released January 30, 2008).
The aforementioned Consolidated Annual Financial Results Release can be found online at:
http://www.jcom.co.jp/ir/en/irlibrary/brief.html
(J:COM Website)
(2) Target Management Indices
Omitted since there have been no significant changes in the J:COM Group’s target management indices as described in the Consolidated Annual Financial Results Release for the Year Ended December 31,2007 (released January 30, 2008).
The aforementioned Consolidated Annual Financial Results can be found online at:
http://www.jcom.co.jp/ir/en/irlibrary/brief.html
(J:COM Website)
(3) Medium- and Long-term Management Strategies and Issues Requiring Action
Omitted since there have been no significant changes in the J:COM Group’s medium- and long-term management strategies and issues requiring action as described in the Consolidated Annual Financial Results Release for the Year Ended December 31, 2007 (released January 30, 2008).
The aforementioned Consolidated Annual Financial Results Release can be found online at:
http://www.jcom.co.jp/ir/en/irlibrary/brief.html
(J:COM Website)
8
Jupiter Telecommunications Co., Ltd.
(Translation from Japanese disclosure to JASDAQ)
4. Semi-annual Consolidated Financial Statements
For the 6 Months Ended June 30, 2008
JUPITER TELECOMMUNICATIONS CO., LTD.
AND SUBSIDIARIES
CONSOLIDATED STATEMENTS OF INCOME
| (YEN IN MILLIONS, EXCEPT SHARE AND PER SHARE AMOUNTS) | |||||||||||||||
| Six months ended June 30, 2008 |
Six months ended June 30, 2007 |
Change | Year ended Dec. 31, 2007 |
||||||||||||
| Account |
Amount | Amount | Amount | (%) | Amount | ||||||||||
| Revenue: |
|||||||||||||||
| Subscription fees |
122,103 | 112,761 | 9,342 | 8.3 | 230,061 | ||||||||||
| Other |
21,712 | 15,355 | 6,357 | 41.4 | 34,447 | ||||||||||
| 143,815 | 128,116 | 15,699 | 12.3 | 264,508 | |||||||||||
| Operating costs and expenses |
|||||||||||||||
| Operating and programming costs |
(55,803 | ) | (51,319 | ) | (4,484 | ) | (8.7 | ) | (104,748 | ) | |||||
| Selling, general and administrative |
(29,333 | ) | (25,010 | ) | (4,323 | ) | (17.3 | ) | (52,722 | ) | |||||
| Depreciation and amortization |
(33,239 | ) | (31,494 | ) | (1,745 | ) | (5.5 | ) | (64,222 | ) | |||||
| (118,375 | ) | (107,823 | ) | (10,552 | ) | (9.8 | ) | (221,692 | ) | ||||||
| Operating income |
25,440 | 20,293 | 5,147 | 25.4 | 42,816 | ||||||||||
| Other income (expenses) : |
|||||||||||||||
| Interest expense, net: |
|||||||||||||||
| Related parties |
(717 | ) | (652 | ) | (65 | ) | (10.0 | ) | (1,332 | ) | |||||
| Other |
(1,612 | ) | (1,443 | ) | (169 | ) | (11.7 | ) | (2,944 | ) | |||||
| Equity in earnings of affiliates |
284 | 136 | 148 | 108.9 | 291 | ||||||||||
| Other income, net |
313 | 338 | (25 | ) | (7.0 | ) | 558 | ||||||||
| Income before income taxes and other items |
23,708 | 18,672 | 5,036 | 27.0 | 39,389 | ||||||||||
| Minority interest in net income of consolidated subsidiaries |
(986 | ) | (1,069 | ) | 83 | 7.8 | (1,883 | ) | |||||||
| Income before income taxes |
22,722 | 17,603 | 5,119 | 29.1 | 37,506 | ||||||||||
| Income tax expense |
(9,659 | ) | (6,065 | ) | (3,594 | ) | 59.2 | (13,514 | ) | ||||||
| Net income |
13,063 | 11,538 | 1,525 | 13.2 | 23,992 | ||||||||||
| Per Share data |
|||||||||||||||
| Net income per share – basic |
1,906.79 | 1,803.39 | 103.40 | 5.7 | 3,650.27 | ||||||||||
| Net income per share – diluted |
1,903.49 | 1,795.57 | 107.92 | 6.0 | 3,638.93 | ||||||||||
| Weighted average number of ordinary shares outstanding – basic |
6,851,517 | 6,397,907 | 453,610 | 7.1 | 6,572,638 | ||||||||||
| Weighted average number of ordinary shares outstanding – diluted |
6,863,393 | 6,425,765 | 437,628 | 6.8 | 6,593,130 | ||||||||||
(Note) Percentages are calculated based on amounts before rounded in Change column.
9
Jupiter Telecommunications Co., Ltd.
(Translation from Japanese disclosure to JASDAQ)
JUPITER TELECOMMUNICATIONS CO., LTD.
AND SUBSIDIARIES
CONSOLIDATED BALANCE SHEETS
| (YEN IN MILLIONS) |
|||||||||
| June 30, 2008 |
December 31, 2007 |
Change | |||||||
| Account |
Amount | Amount | Amount | ||||||
| Current assets: |
|||||||||
| Cash and cash equivalents |
32,268 | 22,890 | 9,378 | ||||||
| Accounts receivable |
12,410 | 13,198 | (788 | ) | |||||
| Allowance for doubtful accounts |
(375 | ) | (356 | ) | (19 | ) | |||
| Deferred tax asset - current |
10,514 | 11,738 | (1,224 | ) | |||||
| Prepaid expenses and other current assets |
5,619 | 5,164 | 455 | ||||||
| Total current assets |
60,436 | 52,634 | 7,802 | ||||||
| Investments: |
|||||||||
| Investments in affiliates |
14,107 | 19,502 | (5,395 | ) | |||||
| Investments in other securities, at cost |
2,141 | 2,139 | 2 | ||||||
| 16,248 | 21,641 | (5,393 | ) | ||||||
| Property and equipment, at cost: |
|||||||||
| Land |
2,923 | 2,789 | 134 | ||||||
| Distribution system and equipment |
552,282 | 523,599 | 28,683 | ||||||
| Support equipment and buildings |
40,045 | 39,148 | 897 | ||||||
| 595,250 | 565,536 | 29,714 | |||||||
| Less accumulated depreciation |
(256,753 | ) | (228,341 | ) | (28,412 | ) | |||
| Total property and equipment at cost |
338,497 | 337,195 | 1,302 | ||||||
| Other assets: |
|||||||||
| Goodwill |
225,239 | 221,493 | 3,746 | ||||||
| Identifiable intangible asset, net |
34,244 | 32,862 | 1,382 | ||||||
| Deferred tax asset – non current |
2,208 | 4,423 | (2,215 | ) | |||||
| Other |
10,948 | 10,168 | 780 | ||||||
| Total other assets |
272,639 | 268,946 | 3,693 | ||||||
| Total assets |
687,820 | 680,416 | 7,404 | ||||||
10
Jupiter Telecommunications Co., Ltd.
(Translation from Japanese disclosure to JASDAQ)
| June 30, 2008 |
December 31, 2007 |
Change | |||||||
| Account |
Amount | Amount | Amount | ||||||
| Current liabilities: |
|||||||||
| Short-term loans |
2,000 | 2,625 | (625 | ) | |||||
| Long-term debt–current portion |
12,179 | 21,308 | (9,129 | ) | |||||
| Capital lease obligations–current portion |
|||||||||
| Related parties |
12,408 | 11,671 | 737 | ||||||
| Other |
2,897 | 2,947 | (50 | ) | |||||
| Accounts payable |
20,144 | 24,279 | (4,135 | ) | |||||
| Income taxes payable |
6,128 | 7,082 | (954 | ) | |||||
| Deposit from related parties |
3,768 | 3,536 | 232 | ||||||
| Deferred revenue – current portion |
6,197 | 6,088 | 109 | ||||||
| Accrued expenses and other liabilities |
8,687 | 6,236 | 2,451 | ||||||
| Total current liabilities |
74,408 | 85,772 | (11,364 | ) | |||||
| Long-term debt, less current portion |
144,591 | 143,219 | 1,372 | ||||||
| Capital lease obligations, less current portion: |
|||||||||
| Related parties |
34,499 | 34,335 | 164 | ||||||
| Other |
5,998 | 6,911 | (913 | ) | |||||
| Deferred revenue |
57,169 | 54,708 | 2,461 | ||||||
| Redeemable preferred stock of consolidated subsidiary |
500 | 500 | — | ||||||
| Deferred tax liability – non current |
10,775 | 12,643 | (1,868 | ) | |||||
| Other liabilities |
8,970 | 6,920 | 2,050 | ||||||
| Total liabilities |
336,910 | 345,008 | (8,098 | ) | |||||
| Minority interests |
6,624 | 5,399 | 1,225 | ||||||
| Shareholders’ equity: |
|||||||||
| Ordinary shares no par value |
117,098 | 116,734 | 364 | ||||||
| Additional paid-in capital |
231,882 | 231,493 | 389 | ||||||
| Accumulated deficit |
2,984 | (10,079 | ) | 13,063 | |||||
| Treasury stock |
(7,520 | ) | (7,520 | ) | — | ||||
| Accumulated other comprehensive income |
(158 | ) | (619 | ) | 461 | ||||
| Total shareholders’ equity |
344,286 | 330,009 | 14,277 | ||||||
| Total liabilities, minority interest and shareholders’ equity |
687,820 | 680,416 | 7,404 | ||||||
11
Jupiter Telecommunications Co., Ltd.
(Translation from Japanese disclosure to JASDAQ)
JUPITER TELECOMMUNICATIONS CO., LTD.
AND SUBSIDIARIES
CONSOLIDATED STATEMENTS OF SHAREHOLDERS’ EQUITY
| (YEN IN MILLIONS) | |||||||||||||||||||
| Ordinary Shares |
Additional paid-in capital |
Comprehensive Income/(Loss) |
Accumulated Deficit |
Accumulated Other Comprehensive Income/(Loss) |
Treasury Stock at cost |
Total Shareholders’ Equity |
|||||||||||||
| Balance at December 31, 2006 |
115,232 | 196,335 | (34,071 | ) | (200 | ) | (0 | ) | 277,296 | ||||||||||
| Net income: |
23,992 | 23,992 | 23,992 | ||||||||||||||||
| Other comprehensive income: |
|||||||||||||||||||
| Changes in the fair value of derivative financial instruments |
(419 | ) | (419 | ) | (419 | ) | |||||||||||||
| Comprehensive income |
23,573 | ||||||||||||||||||
| Stock option exercise |
1,502 | 1,470 | 2,972 | ||||||||||||||||
| Stock compensation (includes paid not issued options) |
141 | 141 | |||||||||||||||||
| Increase due to merger |
33,547 | 33,547 | |||||||||||||||||
| Purchase of treasury stock |
(7,520 | ) | (7,520 | ) | |||||||||||||||
| Balance at December 31, 2007 |
116,734 | 231,493 | (10,079 | ) | (619 | ) | (7,520 | ) | 330,009 | ||||||||||
| Net Income |
13,063 | 13,063 | 13,063 | ||||||||||||||||
| Other comprehensive income: |
|||||||||||||||||||
| Changes in the fair value of derivative financial instruments |
461 | 461 | 461 | ||||||||||||||||
| Comprehensive income |
13,524 | ||||||||||||||||||
| Stock option exercise |
364 | 364 | 728 | ||||||||||||||||
| Stock compensation |
25 | 25 | |||||||||||||||||
| Purchase of treasury stock |
|||||||||||||||||||
| Balance at June 30, 2008 |
117,098 | 231,882 | 2,984 | (158 | ) | (7,520 | ) | 344,286 | |||||||||||
12
Jupiter Telecommunications Co., Ltd.
(Translation from Japanese disclosure to JASDAQ)
JUPITER TELECOMMUNICATIONS CO., LTD.
AND SUBSIDIARIES
CONSOLIDATED STATEMENTS OF CASH FLOWS
| (YEN IN MILLIONS) | |||||||||
| Six months ended June 30, 2008 |
Six months ended June 30, 2007 |
Year ended December 31, 2007 |
|||||||
| Classification |
Amount | Amount | Amount | ||||||
| Cash flows from operating activities: |
|||||||||
| Net income |
13,063 | 11,538 | 23,992 | ||||||
| Adjustments to reconcile net income to net cash provided by operating activities: |
|||||||||
| Depreciation and amortization |
33,239 | 31,494 | 64,222 | ||||||
| Equity in earnings of affiliates |
(284 | ) | (136 | ) | (291 | ) | |||
| Minority interest in net income of consolidated subsidiaries |
986 | 1,069 | 1,883 | ||||||
| Stock compensation expenses |
25 | 90 | 140 | ||||||
| Deferred income taxes |
1,973 | 855 | 1,657 | ||||||
| Non-cash gain from forgiveness of debt |
(135 | ) | — | — | |||||
| Changes in operating assets and liabilities, excluding effects of business combinations: |
|||||||||
| Decrease in accounts receivable, net |
1,131 | 2,084 | 2,477 | ||||||
| (Increase)/decrease in prepaid expenses and other current assets |
(1,549 | ) | (4 | ) | 214 | ||||
| Increase in other assets |
(47 | ) | (1,555 | ) | (2,478 | ) | |||
| Increase/(decrease) in accounts payable |
(4,626 | ) | (2,920 | ) | 412 | ||||
| Increase in accrued expenses and other liabilities |
1,384 | 4,879 | 2,834 | ||||||
| Increase/(decrease) in deferred revenue |
(335 | ) | (239 | ) | 164 | ||||
| Net cash provided by operating activities |
44,825 | 47,155 | 95,226 | ||||||
| Cash flows from investing activities: |
|||||||||
| Capital expenditures |
(17,254 | ) | (20,353 | ) | (46,348 | ) | |||
| Acquisitions of new subsidiaries, net of cash acquired |
(1,131 | ) | — | 634 | |||||
| Acquisition of new business operation |
(1,710 | ) | — | — | |||||
| Investments in and advances to affiliates |
— | — | (1,138 | ) | |||||
| Loan to related party |
— | (3,650 | ) | (5,166 | ) | ||||
| Principle received from related party |
— | — | 1,350 | ||||||
| Acquisition of minority interests in consolidated subsidiaries |
(87 | ) | (951 | ) | (2,543 | ) | |||
| Other investing activities |
118 | 164 | 483 | ||||||
| Net cash used in investing activities |
(20,064 | ) | (24,790 | ) | (52,728 | ) | |||
| Cash flows from financing activities: |
|||||||||
| Proceeds from issuance of common stock |
727 | 2,570 | 2,973 | ||||||
| Purchase of treasury stock |
— | — | (7,520 | ) | |||||
| Change in short-term loans |
(200 | ) | (300 | ) | 335 | ||||
| Proceeds from long-term debt |
25,284 | 253 | 613 | ||||||
| Principal payments of long-term debt |
(33,451 | ) | (8,125 | ) | (25,699 | ) | |||
| Principal payments under capital lease obligations |
(8,499 | ) | (7,852 | ) | (15,689 | ) | |||
| Other financing activities |
756 | (20 | ) | 4,893 | |||||
| Net cash used in financing activities |
(15,383 | ) | (13,474 | ) | (40,094 | ) | |||
| Net increase in cash and cash equivalents |
9,378 | 8,891 | 2,404 | ||||||
| Cash and cash equivalents at beginning of period |
22,890 | 20,486 | 20,486 | ||||||
| Cash and cash equivalents at end of period |
32,268 | 29,377 | 22,890 | ||||||
13
Jupiter Telecommunications Co., Ltd.
(Translation from Japanese disclosure to JASDAQ)
Notes to Interim Period Consolidated Financial Statements
Scope of consolidation
| (1) | Number of consolidated subsidiaries: 30 |
| (2) | The names of major consolidated subsidiaries: J:COM West Co., Ltd., J:COM Kanto Co., Ltd., J:COM Tokyo Co., Ltd. |
| (3) | Change of scope of consolidation |
The consolidated subsidiary J:COM Kansai Co., Ltd. merged with the consolidated subsidiaries Hokusetsu Cable Net Co., Ltd. and Cable West Inc. J:COM Kansai Co., Ltd. was renamed J:COM West Co., Ltd.
The Company acquired the shares of Kyoto Cable Communications Co., Ltd. from other shareholders, making it a consolidated subsidiary from an equity method affiliate.
The Company sold all of its shares of JSBC2 Co., Ltd.
Since there is no significant change from Annual Securities Reports (submitted on March 27, 2008) except for the above, we are not required to provide any additional information.
Segment Information
| (1) | Operating segments |
The Company’s new channel services are considered a separate operating segment, however, due to the insignificant size of these channel service operations, management has determined it has one reportable segment “Broadband communications services” as of June 30, 2008. Therefore, information on operating segments is not applicable in this section.
| (2) | Segment information by region |
Since the Company does not have any overseas subsidiaries or branches, this section is not applicable.
Earning per share
| Six months ended June 30, |
Year ended December 31, | |||||
| 2008 | 2007 | 2007 | ||||
| Net income (Yen in Million) |
13,063 | 11,538 | 23,992 | |||
| Weighted average common shares outstanding: |
||||||
| Basic |
6,851,517 | 6,397,907 | 6,572,638 | |||
| Effect of dilutive common stock equivalents |
11,876 | 27,858 | 20,492 | |||
| Diluted |
6,863,393 | 6,425,765 | 6,593,130 | |||
| Earnings per share (Yen): |
||||||
| Basic |
1,906.79 | 1,803.39 | 3,650.27 | |||
| Diluted |
1,903.49 | 1,795.57 | 3,638.93 | |||
Subsequent events
On July 4, 2008, shareholders of Cable Vision 21, Inc., our consolidated subsidiary, and Fukuoka Cable Network Co., Ltd., our equity method affiliate, agreed to merge these two companies and signed a merger agreement. In accordance with the merger agreement, the merger will take place on September 1, 2008 and FCN will be a surviving entity under a new company name as J:COM Fukuoka Co., Ltd. (JFC) and JFC will become our consolidated subsidiary. Upon the merger, we expect that JFC will provide a higher level of assurance and reliability to its subscribers by enhancing its presence in the market as a largest cable TV company in the Kyushu area. Also, we expect that this merger will enable JFC to improve its financial strength and business efficiency, to further expand service areas, and to contribute community in the Kyushu area by providing improved access and service.
14
Jupiter Telecommunications Co., Ltd.
(Translation from Japanese disclosure to JASDAQ)
5. Semi-annual financial Statements
For the 6 Months Ended June 30, 2008
JUPITER TELECOMMUNICATIONS CO., LTD
(Parent Company Only-Japanese GAAP)
STATEMENTS OF INCOME
| (YEN IN MILLIONS) | ||||||||||||||
| Six months ended June 30, 2008 |
Six months ended June 30, 2007 |
Change | Year ended Dec 31, 2007 |
|||||||||||
| Account |
Amount | Amount | Amount | (%) | Amount | |||||||||
| Sales |
56,092 | 49,566 | 6,526 | 13.2 | 107,807 | |||||||||
| Cost of sales |
44,341 | 41,241 | 3,100 | 7.5 | 87,952 | |||||||||
| Gross income |
11,751 | 8,325 | 3,426 | 41.2 | 19,855 | |||||||||
| Selling, general & administrative expenses |
6,756 | 5,459 | 1,297 | 23.8 | 11,708 | |||||||||
| Operating income |
4,995 | 2,866 | 2,129 | 74.3 | 8,147 | |||||||||
| Non-Operating profit |
1,532 | 1,815 | (283 | ) | (15.6 | ) | 3,635 | |||||||
| Non-Operating charges |
1,407 | 1,584 | (177 | ) | (11.2 | ) | 3,126 | |||||||
| Ordinary income |
5,120 | 3,097 | 2,023 | 65.3 | 8,656 | |||||||||
| Extraordinary gain |
710 | — | 710 | — | — | |||||||||
| Extraordinary losses |
144 | — | 144 | — | 59 | |||||||||
| Net Income before taxes |
5,686 | 3,097 | 2,589 | 83.6 | 8,597 | |||||||||
| Income taxes & inhabitant taxes |
16 | 1,392 | (1,376 | ) | (98.9 | ) | 3,661 | |||||||
| Income taxes – deferred |
1,709 | (1,324 | ) | (3,033 | ) | — | (1,391 | ) | ||||||
| Net Income after taxes |
3,961 | 3,029 | 932 | 30.8 | 6,327 | |||||||||
(Note) Percentages are calculated based on amounts before rounded in Change column.
15
Jupiter Telecommunications Co., Ltd.
(Translation from Japanese disclosure to JASDAQ)
JUPITER TELECOMMUNICATIONS CO., LTD
(Parent Company Only-Japanese GAAP)
BALANCE SHEETS
| (YEN IN MILLIONS) | ||||||||||||||||||
| June 30, 2008 |
December 31, 2007 |
Change | Account |
June 30, 2008 |
December 31, 2007 |
Change | ||||||||||||
| Account |
Amount | Amount | Amount | Amount | Amount | Amount | ||||||||||||
| Current assets: |
Current liabilities: | |||||||||||||||||
| Cash and cash equivalents |
1,698 | 1,437 | 261 | Accounts payable-Trade |
8,882 | 7,964 | 918 | |||||||||||
| Accounts receivable-Trade |
11,952 | 11,533 | 419 | Long-term debt-current portion |
8,984 | 18,075 | (9,091 | ) | ||||||||||
| Inventories |
1,161 | 359 | 802 | Other current liabilities |
5,053 | 10,849 | (5,796 | ) | ||||||||||
| Other current assets |
39,434 | 24,089 | 15,345 | Total current liabilities |
22,919 | 36,888 | (13,969 | ) | ||||||||||
| Total current assets |
54,245 | 37,418 | 16,827 | Fixed liabilities: |
||||||||||||||
| Long-term debt | 130,477 | 128,151 | 2,326 | |||||||||||||||
| Other long term liabilities |
9,943 | 15,649 | (5,706 | ) | ||||||||||||||
| Total fixed liabilities |
140,420 | 143,800 | (3,380 | ) | ||||||||||||||
| Fixed assets |
Total Liabilities |
163,339 | 180,688 | (17,349 | ) | |||||||||||||
| Tangible fixed assets |
2,821 | 2,962 | (141 | ) | Stockholders’ equity |
|||||||||||||
| Intangible fixed assets |
10,896 | 19,800 | (8,904 | ) | Common stock |
117,098 | 116,734 | 364 | ||||||||||
| Investments to subsidiaries and affiliates |
263,604 | 269,612 | (6,008 | ) | Capital surplus: |
|||||||||||||
| Long-term loans to related parties |
78,400 | 92,300 | (13,900 | ) | Capital reserve |
31,237 | 30,873 | 364 | ||||||||||
| Other assets |
4,966 | 5,054 | (88 | ) | Additional paid-in capital |
94,132 | 94,132 | — | ||||||||||
| Total investments and other assets |
346,970 | 366,966 | (19,996 | ) | Total Capital Surplus |
125,369 | 125,005 | 364 | ||||||||||
| Total fixed assets |
360,687 | 389,728 | (29,041 | ) | Accumulated profit | |||||||||||||
| Retained earnings carried forward |
16,770 | 12,809 | 3,961 | |||||||||||||||
| Total retained earnings |
16,770 | 12,809 | 3,961 | |||||||||||||||
| Treasury stock | (7,520 | ) | (7,520 | ) | — | |||||||||||||
| Total Stockholder’s equity |
251,717 | 247,028 | 4,689 | |||||||||||||||
| Revaluation surplus | ||||||||||||||||||
| Deferred hedge gain (loss) | (147 | ) | (584 | ) | 437 | |||||||||||||
| Total Revaluation surplus |
(147 | ) | (584 | ) | 437 | |||||||||||||
| Stock option | 23 | 14 | 9 | |||||||||||||||
| Total Net Assets |
251,593 | 246,458 | 5,135 | |||||||||||||||
| Total Assets |
414,932 | 427,146 | (12,214 | ) | Total Liabilities and Net Assets |
414,932 | 427,146 | (12,214 | ) | |||||||||
16
Jupiter Telecommunications Co., Ltd.
(Translation from Japanese disclosure to JASDAQ)
JUPITER TELECOMMUNICATIONS CO., LTD
(Parent Company Only-Japanese GAAP)
STATEMENT OF STOCKHOLDERS’ EQUITY
| For the 6 months ended June 30, 2008 | (YEN IN MILLIONS) | ||||||||||||||||
| Stockholders’ equity | |||||||||||||||||
| Capital Surplus | Retained Earnings | ||||||||||||||||
| Accumulated profit |
|||||||||||||||||
| Common stock |
Capital reserve |
Additional paid-in capital |
Total capital surplus |
Retained earnings carried forward |
Total retained earnings |
Treasury stock |
Total Stockholders’ equity | ||||||||||
| Balance at December 31, 2007 |
116,734 | 30,873 | 94,132 | 125,005 | 12,809 | 12,809 | (7,520 | ) | 247,028 | ||||||||
| Movement for this period |
|||||||||||||||||
| Net income |
3,961 | 3,961 | 3,961 | ||||||||||||||
| Stock option exercise |
364 | 364 | 364 | 728 | |||||||||||||
| Movement other than Stockholders’ equity item |
— | ||||||||||||||||
| Total movement |
364 | 364 | 364 | 3,961 | 3,961 | 4,689 | |||||||||||
| Balance at June 30, 2008 |
117,098 | 31,237 | 94,132 | 125,369 | 16,770 | 16,770 | (7,520 | ) | 251,717 | ||||||||
| Revaluation surplus | ||||||||||
| Deferred hedge gain (loss) |
Total revaluation surplus |
Stock option | Total Net assets | |||||||
| Balance at December 31, 2007 |
(584 | ) | (584 | ) | 14 | 246,458 | ||||
| Movement for this period |
||||||||||
| Net income |
3,961 | |||||||||
| Stock option exercise |
728 | |||||||||
| Movement other than Stockholders’ equity item |
437 | 437 | 9 | 446 | ||||||
| Total movement |
437 | 437 | 9 | 5,135 | ||||||
| Balance at June 30, 2008 |
(147 | ) | (147 | ) | 23 | 251,593 | ||||
17
Jupiter Telecommunications Co., Ltd.
(Translation from Japanese disclosure to JASDAQ)
| For the 12 months ended December 31, 2007 | (YEN IN MILLIONS) | ||||||||||||||||||||
| Stockholders’ equity | |||||||||||||||||||||
| Capital Surplus | Retained Earnings | ||||||||||||||||||||
| Accumulated profit |
|||||||||||||||||||||
| Common stock |
Advance on subscription |
Capital reserve |
Additional paid-in capital |
Total capital surplus |
Retained earnings carried forward |
Total retained earnings |
Treasury stock |
Total Stockholders’ equity |
|||||||||||||
| Balance at December 31, 2006 |
115,232 | 32 | 29,371 | 42,230 | 71,601 | 6,482 | 6,482 | (0 | ) | 193,347 | |||||||||||
| Movement for this period |
|||||||||||||||||||||
| Net income |
6,327 | 6,327 | 6,327 | ||||||||||||||||||
| JTV merger |
51,902 | 51,902 | 51,902 | ||||||||||||||||||
| Treasury stock |
(7,520 | ) | (7,520 | ) | |||||||||||||||||
| Stock option exercise |
1,486 | 1,486 | 1,486 | 2,972 | |||||||||||||||||
| Reclassified from Advance on subscription to Common stock or Capital reserve |
16 | (32 | ) | 16 | 16 | — | |||||||||||||||
| Movement other than Stockholders’ equity item |
— | ||||||||||||||||||||
| Total movement |
1,502 | (32 | ) | 1,502 | 51,902 | 53,404 | 6,327 | 6,327 | (7,520 | ) | 53,681 | ||||||||||
| Balance at December 31, 2007 |
116,734 | — | 30,873 | 94,132 | 125,005 | 12,809 | 12,809 | (7,520 | ) | 247,028 | |||||||||||
| Revaluation surplus | |||||||||||
| Deferred hedge gain(loss) |
Total revaluation surplus |
Stock option | Total Net assets | ||||||||
| Balance at December 31, 2006 |
(192 | ) | (192 | ) | — | 193,155 | |||||
| Movement for this period |
|||||||||||
| Net income |
6,327 | ||||||||||
| JTV merger |
51,902 | ||||||||||
| Treasury stock |
(7,520 | ) | |||||||||
| Stock option exercise |
2,972 | ||||||||||
| Reclassified from Advance on subscription to Common stock or Capital reserve |
— | ||||||||||
| Movement other than Stockholders’ equity item |
(392 | ) | (392 | ) | 14 | (378 | ) | ||||
| Total movement |
(392 | ) | (392 | ) | 14 | 53,303 | |||||
| Balance at December 31, 2007 |
(584 | ) | (584 | ) | 14 | 246,458 | |||||
18
Jupiter Telecommunications Co., Ltd.
(Translation from Japanese disclosure to JASDAQ)
Change of Significant Accounting Policies (Parent Only-Japanese GAAP)
Due to early adoption of new accounting guidance, JICPA Accounting Standard Committee Report No. 10 (The revision of the practical guidance for deferred income tax accounting for stand alone financial statements), our operating income and ordinary income both increased by ¥422 million and our net income before taxes increased by ¥703 million.
Additional Information
Business combination
Based on the JTV valuation report updated by the supplemental information we had acquired during the current half year, the purchase price allocation was finalized since the previous purchase price allocation was based on preliminary estimates of fair value with the available data at the time.
The carrying amount of goodwill was adjusted based on the final purchase price allocation and the application of new practical guidelines, deferred tax accounting for financial statement, as follow.
| (Yen in Millions) | |||
| Account |
Change in goodwill | ||
| <Purchase price allocation> |
|||
| Current assets (Other current assets) |
12 | ||
| Non-current assets (Investments in subsidiaries and affiliates) |
7,168 | ||
| Subtotal |
7,180 | ||
| <Effect of early adoption of new accounting guidance > |
|||
| Other long-term liabilities (Deferred income tax) |
(15,619 | ) | |
| Total |
(8,439 | ) | |
19
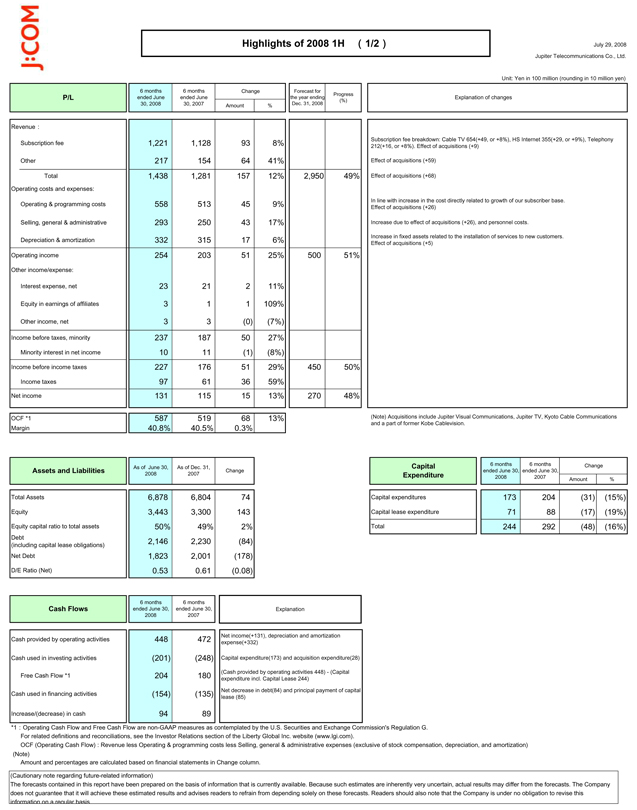
July 29, 2008
Jupiter Telecommunications Co., Ltd.
Unit: Yen in 100 million (rounding in 10 million yen)
P/L 6 months
ended June
30, 2008 6 months
ended June
30, 2007 Change Forecast for the year ending Dec. 31, 2008 Progress (%) Explanation of changes
Amount %
Revenue:
Subscription fee 1,221 1,128 93 8% Subscription fee breakdown: Cable TV 654(+49, or +8%), HS Internet 355(+29, or +9%), Telephony 212(+16, or +8%). Effect of acquisitions (+9)
Other 217 154 64 41% Effect of acquisitions (+59)
Total 1,438 1,281 157 12% 2,950 49% Effect of acquisitions (+68)
Operating costs and expenses:
Operating & programming costs 558 513 45 9% In line with increase in the cost directly related to growth of our subscriber base.
Effect of acquisitions (+26)
Selling, general & administrative 293 250 43 17% Increase due to effect of acquisitions (+26), and personnel costs.
Depreciation & amortization 332 315 17 6% Increase in fixed assets related to the installation of services to new customers.
Effect of acquisitions (+5)
Operating income 254 203 51 25% 500 51%
Other income/expense:
Interest expense, net 23 21 2 11%
Equity in earnings of affiliates 3 1 1 109%
Other income, net 3 3 (0) (7%)
Income before taxes, minority 237 187 50 27%
Minority interest in net income 10 11 (1) (8%)
Income before income taxes 227 176 51 29% 450 50%
Income taxes 97 61 36 59%
Net income 131 115 15 13% 270 48%
OCF *1 587 519 68 13% (Note) Acquisitions include Jupiter Visual Communications, Jupiter TV, Kyoto Cable Communications and a part of former Kobe Cablevision.
Margin 40.8% 40.5% 0.3%
Assets and Liabilities As of June 30, 2008 As of Dec. 31, 2007 Change Capital
Expenditure 6 months
ended June 30, 2008 6 months
ended June 30, 2007 Change
Amount %
Total Assets 6,878 6,804 74 Capital expenditures 173 204 (31) (15%)
Equity 3,443 3,300 143 Capital lease expenditure 71 88 (17) (19%)
Equity capital ratio to total assets 50% 49% 2% Total 244 292 (48) (16%)
Debt
(including capital lease obligations) 2,146 2,230 (84)
Net Debt 1,823 2,001 (178)
D/E Ratio (Net) 0.53 0.61 (0.08)
Cash Flows 6 months
ended June 30, 2008 6 months
ended June 30, 2007
Cash provided by operating activities 448 472
Net income(+131), depreciation and amortization expense(+332)
Cash used in investing activities (201) (248)
Capital expenditure(173) and acquisition expenditure(28)
Free Cash Flow *1 204 180
(Cash provided by operating activities 448) - (Capital expenditure incl. Capital Lease 244)
Cash used in financing activities (154) (135)
Net decrease in debt(84) and principal payment of capital lease (85)
Increase/(decrease) in cash 94 89
*1 Operating Cash Flow and Free Cash Flow are non-GAAP measures as contemplated by the U.S. Securities and Exchange Commission’s Regulation G.
For related definitions and reconciliations, see the Investor Relations section of the Liberty Global Inc. website (www.lgi.com).
OCF (Operating Cash Flow) : Revenue less Operating & programming costs less Selling, general & administrative expenses (exclusive of stock compensation, depreciation, and amortization)
(Note)
Amount and percentages are calculated based on financial statements in Change column.
20
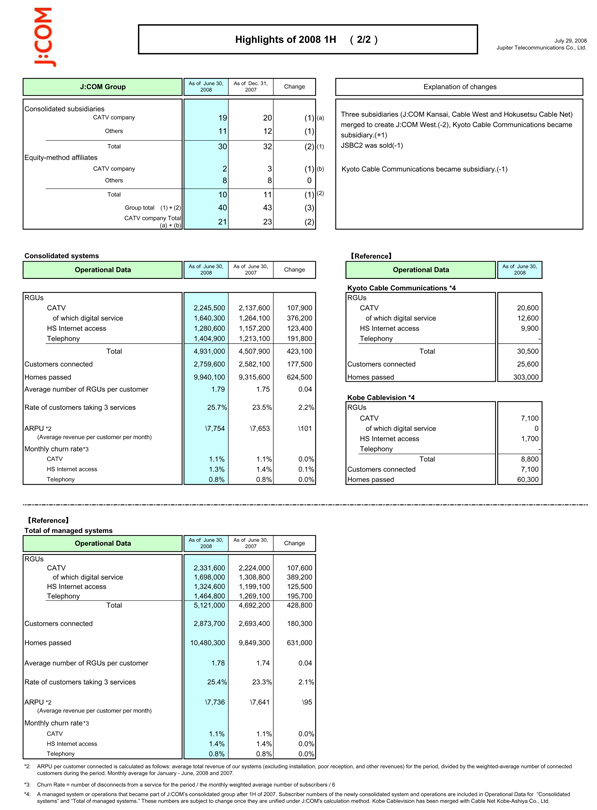
July 29, 2008
Jupiter Telecommunications Co., Ltd.
J:COM Group As of June 30, 2008 As of Dec. 31, 2007 Change Explanation of changes
Consolidated subsidiaries
CATV company 19 20 (1) (a)
Others 11 12 (1)
Total 30 32 (2) (1)
Equity-method affiliates
CATV company 2 3 (1) (b)
Others 8 8 0
Total 10 11 (1) (2)
Group total(1)+(2) 40 43 (3)
CATV company Total
(a) + (b) 21 23 (2)
Consolidated systems Reference
Operational Data As of June 30, 2008 As of June 30, 2007 Change Operational Data As of June 30, 2008
Kyoto Cable Communications *4
RGUs RGUs
CATV 2,245,500 2,137,600 107,900 CATV 20,600
of which digital service 1,640,300 1,264,100 376,200 of which digital service of which digital service 12,600
HS Internet access 1,280,600 1,157,200 123,400 HS Internet access HS Internet access 9,900
Telephony 1,404,900 1,213,100 191,800 Telephony -
Total 4,931,000 4,507,900 423,100 Total 30,500
Customers connected 2,759,600 2,582,100 177,500 Customers connected 25,600
Homes passed 9,940,100 9,315,600 624,500 Homes passed 303,000
Average number of RGUs per customer 1.79 1.75 0.04
Kobe Cablevision *4
Rate of customers taking 3 services 25.7% 23.5% 2.2% RGUs
CATV 7,100
ARPU *2 \7,754 \7,653 \101 of which digital service 0
(Average revenue per customer per month) HS Internet access 1,700
Monthly churn rate *3 Telephony -
CATV 1.1% 1.1% 0.0% Total 8,800
HS Internet access 1.3% 1.4% 0.1% Customers connected 7,100
Telephony 0.8% 0.8% 0.0% Homes passed 60,300
Reference
Total of managed systems
Operational Data As of June 30, 2008 As of June 30, 2007 Change
RGUs
CATV 2,331,600 2,224,000 107,600
of which digital service 1,698,000 1,308,800 389,200
HS Internet access 1,324,600 1,199,100 125,500
Telephony 1,464,800 1,269,100 195,700
Total 5,121,000 4,692,200 428,800
Customers connected 2,873,700 2,693,400 180,300
Homes passed 10,480,300 9,849,300 631,000
Average number of RGUs per customer 1.78 1.74 0.04
Rate of customers taking 3 services 25.4% 23.3% 2.1%
ARPU *2 \7,736 \7,641 \95
(Average revenue per customer per month)
Monthly churn rate *3
CATV 1.1% 1.1% 0.0%
HS Internet access 1.4% 1.4% 0.0%
Telephony 0.8% 0.8% 0.0%
*2: ARPU per customer connected is calculated as follows: average total revenue of our systems (excluding installation, poor reception, and other revenues) for the period, divided by the weighted-average number of connected customers during the period. Monthly average for January - June, 2008 and 2007.
*3: Churn Rate = number of disconnects from a service for the period / the monthly weighted average number of subscribers / 6
*4: A managed system or operations that became part of J:COM’s consolidated group after 1H of 2007. Subscriber numbers of the newly consolidated system and operations are included in Operational Data for “Consolidated systems” and “Total of managed systems.” These numbers are subject to change once they are unified under J:COM’s calculation method. Kobe Cablevision has been merged with Cable Net Kobe-Ashiya Co., Ltd.
21